CLICK HERE to download, read or print our "Stop The Light Rail" brochure.
The Gold Coast’s premier bus route
Information is gathered from a range of sources, including the Goldlinq website, correspondence with the Plenum Group, media reports and Government publications, and of course calculations. (And is subject to release of actual data from the Goldlinq/Government private partnership).
Cost
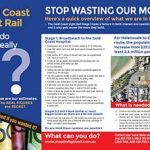
The construction cost of Stage 1 calculated here is $2.24 billion. That equates to $172 million per kilometre. We are happy with that as the Sydney and Newcastle Light Rail projects are currently running at $220 million per kilometre. So, we are low on the estimates.
Operation
- Stage 1 loses $45 million per year on its operating costs,
- We, the taxpayers, pay for it through the Department of Transport and Main Roads, (see their annual reports 2015/16 page 262 and 2016/17 page 228).
- The subsidy paid is equal to half again of the subsidy paid for the whole of the Gold Coast bus routes, or 7% of the whole of Queensland bus subsidies, for just a 13km length.
- By calculation, allowing an average of $5 per ticket, and allowing 21,900 passengers per day, Goldlinq’s income is $40 million per year.
- That makes a total operating cost of $85 million per year or $6.5 million per kilometre per year.
Interest
- There is a spreadsheet of the calculations on page 4 of this website.
- The Interest bill calculation is made up of 2 sources.
- The first, from the ‘contract’ price that Goldlinq has with the Government. It appears that Goldlinq borrows the money on behalf of the Government, and charge it to the Government (that’s us, the taxpayer) at 9.22%.
- 9.22% is an outrageous amount.
- Then, of course, Goldlinq pass on the cost to The Queensland Department of Transport and Main Roads, and they (or we the taxpayers) are liable for the bill. (see Department of Transport and Main Roads report 2015/16 page 229).
- The second part of the interest cost is applied to the funds that the 3 levels of Government have supplied, and it has been allowed at 5%.
- The calculated combined annual interest bill for Stage 1 is $171 million per year
- The combined operating cost and interest bill is $171 million plus $85 million; this equals $256 million per year.
- From the Department of Main roads report in 2015/16, we assume from the text, that the Government takes over the whole operation from Goldlinq over 15 years, at 9.22% interest rate.
- There is no allowance for capital repayment in this review. If the capital were to be repaid all the costs and numbers would be double.
Common sense:
- Using the calculations on page 4 of this website, Goldlinq’s interest bill to the Government is at least $129 million per year.
- Perhaps we should buy out Goldlinq, and then have Translink take over the operation, pay out the debt and replace the loan with a Government Bond at about 3%. The calculation is:
- 1.4 billion at 9.22% is $129 million per year
- 1.4 billion at 3% is $42 million per year
- the saving would be $87 million per year or $6.7 million per kilometre
Patronage
- The Broadbeach to the Gold Coast Hospital and the University station is the Gold Coasts most popular route
- Prior to the tram service, the bus patronage numbers on the same route were approximately 17,000 per day. The light rail reported in the first year of operation 16,436 passengers/day, with increases to 21,800 in the year ended 2017.
- With the opening of the Gold Coast Hospital and the extension to the University, the daily patronage has increased to about 22,000,
- That is a natural increase that either the tram or the bus service would have picked up
For the calculation’s here we’ve used 25,000 passengers per day, and a fare of $5 per person.
According to the Australian Bureau of Statistics, there are 95,000 residents along Stage 1 route, although a large proportion are more than a 10-minute walk from the tram stations.
The 25,000 passengers per day equate to 26% of the population.
The $40 million income provided per year, when combined with the operational and interest costs of $256 million,
- Shows a loss of $216 million per year, or a $16.6 million loss per kilometre, or a $590,000 loss per day.
To break even, an income required per day is calculated by the annual cost of $256 million/365 days, equalling $701,000.
Divide $701,000 by $5, and we need 140,273 passengers each day (more than the local population each day).
Given the current patronage is 26% of the current population of 95,000, the required population is calculated backwards by taking 140,000 people times 100 and divided by 26, and the result is 538,000 residents required to provide the 140,000 passengers each day.
Surprisingly, that is 2.5 times the forecast growth of the whole of the Gold Coast, from Yatala to Coolangatta over the next ten years.
That is equivalent to population growth to about the size of Brisbane, based on the area.
Do you think that will happen? Next year, or in 10 years, or a 100?
Unfortunately, that growth won’t happen for well over a hundred years, and if we could work out how to fit them all in 800 metres each side of the tram line.
Stage 1 summary
- Cost $2,240 million.
- 13km long ($172 million/km).
- Interest cost per annum is $171 million.
- Operational costs are $85 million/year ($6.5 million/km).
- Customers at approximately 25,000/day (or 26% of the current population) create about a $40 million/year income.
- Total of operating costs and interest cost is $256 million per annum ($701,000/day).
- Or $19 million/km/year.
- Passengers required per day at $5 per ticket is 140,000,
- Current population 95,000 (Australian Bureau of Statistics, ABS)
- Population needed: 538,000 (ie: 140,000 times 100 divided by 26)
- If the trams carry the population needed to break even, and they are half full, we will need 50 trams per hour or 1 every minute. (140,000 divided by 154 passengers per tram divided by 18-hour service)
- Where will all the buses needed park, and how will they fit on the road, as they need 2.5 buses for each half full tram?
An overall summary, based on Stage 1 and 2.
Tram cycles
The carriages carry 309 people.
If we allow, for Stage 1 and 2, the break-even passenger numbers of 200,500 per day,
- The number of trams per day required is 200,500/309 which equals 650 trams per day.
- Assuming they run for 18 hours per day, 650 trams/18 hours provides a need for 32 trams per hour.
- Or 32 per hour/60 minutes, provides for a service every 1.9 minutes.
- Or if they are only half full, they’ll need 64 trams every hour, which then requires a train every minute.
- Or if they are only ¼ full, they’ll need one train every 30 seconds.
The numbers are quite unbelievable.
Tram numbers
Using half full trams, there are 64 trams required/hour:
- 1 tram every minute (or 2 minutes on the up line and 2 minutes on the down line)
- One direction requires 32 on the track up and 32 on the track down, so a total of 64 trams running full time on the track every day.
(We only own 18, so another 46 trams are required at $5 million a tram is $230,000,000 all paid to an offshore supplier).
The question is then, where do they fit, where are they parked, what happens to car and truck traffic on the roads and so on? The trams will be nose to tail.
None of these additional 46 trains and their operating costs are included in the cost analysis.
Where do the buses park as each half full tram of 154 people every minute requires 3 buses to pick up the 154 passengers?
Where do the customers park their cars? 60 trams an hour, 154 people per tram could equate to 9,856 car parks per hour!
Alternate spending options
What could all Queensland taxpayers have got for the capital expenditure of $2.89 billion for Stage 1 and Stage 2, Broadbeach to Helensvale?
| Support 1,100,000 children in poverty | $2,627 each |
| 8 lane freeway at $50 million per kilometre | 57.8 kms, which is Helensvale Brisbane |
| 8 lane freeway at $50 million per kilometre | 2.4 freeways from Robina to Tweed Heads |
| 2 lane country road at $5 million per kilometre | 578 kms |
| Police at $150,000 each per year | 19,000 police |
| Aged Care support at $50,000 per person | 57,800 people supported |
| Emergency Hospital Beds at $5,000 per night | 578,000 beds |
| Schools at $15 million each (primary) | 192 new schools |
What could all Queensland taxpayers have got for $328 million operating losses every year for stage 1 and 2?
| Support 1,100,000 children in poverty | $298 each per year |
| 8 lane freeway at $50 million per kilometre | 6.5 kms per year |
| 8 lane freeway at $50 million per kilometre | 1/3 of the way from Robina to Tweed Heads every year |
| 2 lane country road at $5 million per kilometre | 65 kms every year |
| Police at $150,000 each per year | 2,186 police every year |
| Aged Care support at $50,000 per person | 6,560 people supported every year |
| Emergency Hospital Beds at $5,000 per night | 65,600 beds every year |
| Schools at $15 million each (primary) | 22 new schools every year |